
In the following article, Jesús Membreño (poultry group MES lead at Cargill) shares his knowledge gained during a multi-site implementation of the CAT2 MES (Manufacturing Execution System) for Cargill Central America. The implementation included integration into plant-floor hardware as well as the company’s ERP system (Enterprise Resource Planning) to maximize data management capabilities by harnessing the power of IIoT (Industrial Internet of Things). By using the multi-plant benchmarking process, Cargill creates meaningful, shareable knowledge from many terabytes of data.
Five years ago, Cargill Central America implemented our first CAT2 MES for a poultry processing plant. Prior to this journey, our team approached process improvement by looking at our processing plants like a black box using non-representative sampling. The obvious drawback to this approach is that best practices are not identified and shared across our manufacturing units. At Cargill, we are encouraged to treat money as if it was our own because we are accountable for every capital project. For the CAT2 deployment, our team defined and analyzed our value drivers to determine where to expect a return on investment (ROI).
Process Mapping: Peering into the Black Box
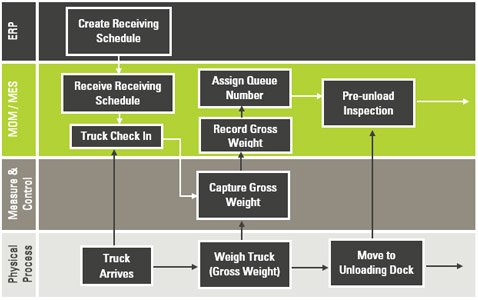
Shown above is an example of a process map. CAT Squared uses process mapping to help customers get a visual overview of their processes and understand how data flows across their network.
During the first phase, we developed a process map to have a visual understanding of processes occurring on the plant floor, what data was being measured during those processes, and how that data was flowing across our network. As part of this process, we defined meaningful metrics and value drivers using a value-driver matrix. This helped us prioritize our operational value drivers and develop measurable KPIs (Key Performance Indicators) for data-driven decision-making. Even though we have a generic template as a target, some opportunities are site-specific. If you’re lucky, you might spot some quick wins that will help engage the local team.
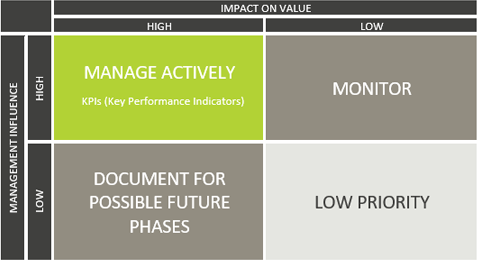
The value driver matrix illustrates a framework for prioritizing value drivers.
Once the system is live, it is important to establish a baseline for the KPIs that were identified in the mapping process. You may discover some underlying assumptions skewed your original analysis. For example, when the targets were first defined, they might have been set by sampling and not by the real measurement of an entire day´s performance. The first objective for improvement is to consistently measure and achieve your internal targets.
Not all KPI´s can be measured equally. For example, you might have plants with a different product mix; in this case, they can measure against their ability to meet their own target. Other KPI´s like OEE, dead birds on arrival (DOA%), or shackle-fill percentage in live hanging can have a similar target across all sites.
Benchmarking as a Tool Aiding Continuous Improvement
Once the system and operation are stable, it might not be easy to spot opportunities. There is a never-ending need to control cost, improve yield or productivity. We began asking questions like:
- Is this really the best we can achieve?
- What is a good result for this indicator?
- What other KPIs were identified and brought value elsewhere?
This is where benchmarking is valuable. When you have multiple production facilities sharing information, uncovering best practices and determining where to invest is simplified. For example, when selecting equipment, you may notice that plants using a certain model are more productive and have less downtime. This shared business knowledge will simplify vendor selection. But creating a fully integrated system that delivers the standardized data necessary for sound decision-making requires leadership, process controls, and governance.
The Right Champion Matters
Leadership matters. By nature, people try to maintain the status quo. Having leaders as change agents encourages employees to expand outside their comfort zones, creates standards of accountability, and keeps the team focused on the operational vision.
Process Controls and Standardization: Building the Operational Vision
A key part of the process-mapping exercise was the gap analysis where we defined our present state and future state. Sharing results sounds nice, but when you start getting into smaller details, you might find out not all plants measure yield the same way. Or you may uncover performance metrics like "equipment availability" or "Operational Equipment Effectiveness (OEE)" are defined differently between plants. You might find that some plant operators use certain exceptions, like "we don't consider downtime when it is XYZ-related." You must have a change management plan for your main metrics to achieve standardization. You may experience resistance when one plant operator is used to reporting 95% in a certain metric, but the new formula adjusts that metric to 85%; here again, is where strong leadership is important.

A gap analysis is the comparison of a system's current, actual performance against the desired performance.
Governance and Version Control for Reporting Standards
Establishing a data governance framework is key for establishing reporting standards. Without such a framework, your data will lack meaning. There will be different versions of each report from multiple plants with no uniform standard defining how metrics are measured or reported. There should be a list of must-have reports that have common metrics that will be measured the same across all sites. Some value drivers might only be relevant for one plant, so plant-specific reports can also be created if they add value. For example, you may mostly do semi-automatic deboning across the business, but one plant might have a fully automated line for thighs, and you want to measure its performance. There should be a clear definition of who owns the decision on the standard reports and formulas as well as an approval process for changes.
Building a Culture of Knowledge Sharing
As more plants come online with new deployments, building a leadership council is imperative for sharing best practices, establishing and maintaining standards, and holding each other accountable to those standards. As part of implementing a continuous improvement process, the council should formally meet once a week to share insights and best practices. I personally believe the membership of the council should include supervisors and middle management. This provides them with a feeling of responsibility and accountability, while also exposing them to processes outside their own plant. Each plant can share what went well and what were their challenges, others can fill in from their experience on how they have handled a similar situation.
Climbing the DIKW Pyramid (Data, Information, Knowledge, Wisdom)
Information is derived from data, knowledge is built from information, and wisdom is gained from knowledge. Modern IIoT systems empower the industry with methods of collecting and manipulating massive amounts of data, creating noise. To make data meaningful, your team needs access to dynamic reports that convey volumes of data in a digestible manner. To build these reports, your team must answer the following questions:
- What questions do you need to be answered to make good decisions?
- Do you have the systems in place to collect that data and present it visually?
- How often does the report need to be refreshed? Must you be able to see the data in real-time?
- Who else needs access to this data?
- What process will be put in place by the leadership team to routinely discuss the data, share knowledge, and make strategic decisions?
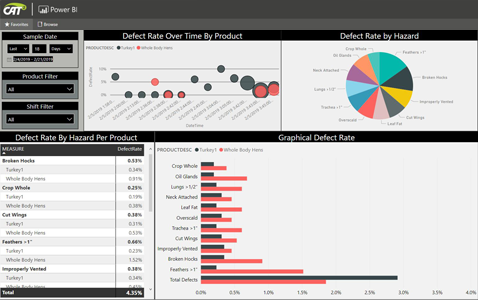
Shown above is a CAT2 dashboard example using Power BI (for illustration only).
Once these questions are answered, there are several options for presenting the data:
- You could download reports locally and consolidate them. This is a good option if you are beginning to define a process and align definitions.
- You might also ask CAT2 to create logic that centralizes data into one report accessible through their executive dashboard.
- There are also several reporting tools like Power BI and Tableau that can enable business-intelligence teams to create reports internally. These last tools are useful if the report does not have to show granular data and if the data refresh is only needed a few times a day (not close to real-time). You can choose an option that fits your internal capabilities, needs, and budget.
Success ultimately depends on the process behind the multi-site benchmarking to make it formal and meaningful. Having talented people engaged in knowledge sharing who are accountable for results will deliver exceptional outcomes.