Automation Methodology

Applying Industry 4.0 Principles to Drive Continuous Improvement 

Continuous improvement is the fundamental foundation of manufacturing. Many get lost seeking solutions in the latest technologies and forget to focus on the goals they hope to accomplish. Technology is an enabler of continuous improvement, not a substitute.

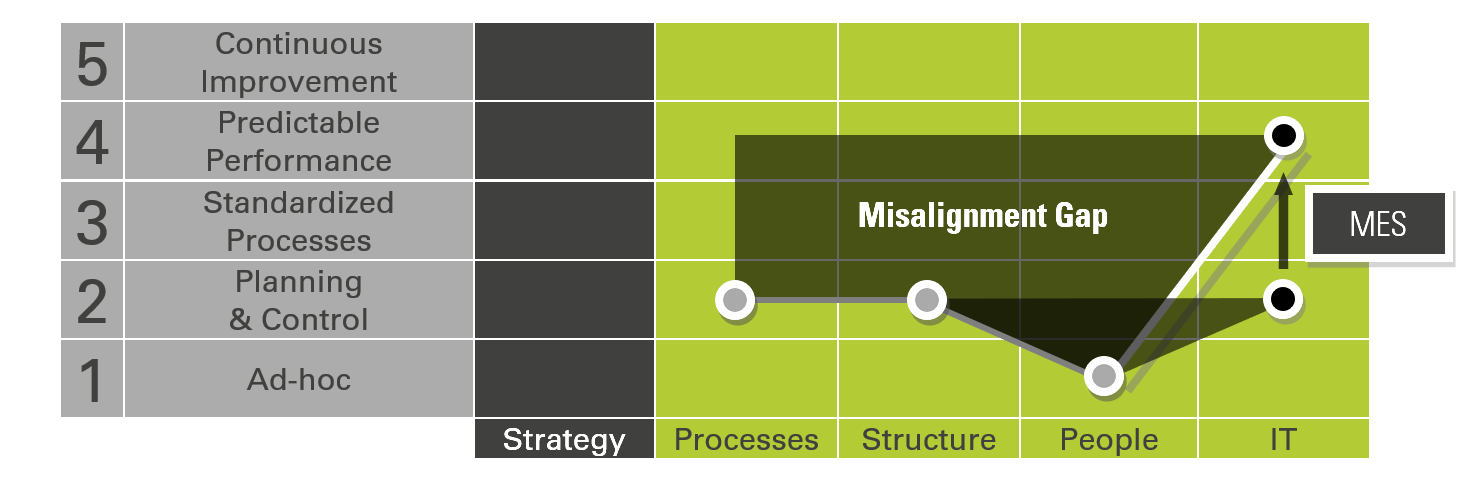
CAT Squared's approach to technology adoption addresses the misalignments between process, structure, employee skillset, and IT. This process ensures our customers will continue to beat their benchmarks, improving operational efficiency long after the initial implementation is complete.

Manufacturing Operations Management

MOM Mapping

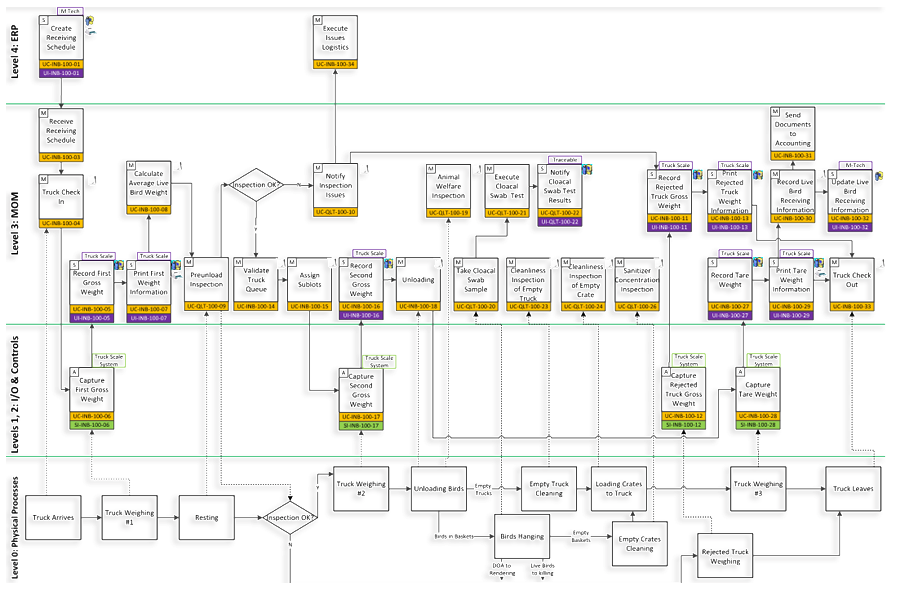
A process map provides a visual understanding of activities occurring on the plant floor, what data is measured during those processes, and how that data flows across the customer’s network.

MOM-Mapping

Manufacturing Maturity Model

Assessing an Organization's Readiness for Industry 4.0

Our team takes a holistic approach for addressing misalignments in the four domains of processes, structure, people, and IT. Technology is a tool, not an end in itself. As the table below illustrates, manufacturing efficiency cannot be optimized beyond the weakest link within these four domains. For an organization to achieve continuous-improvement excellence, it must first have processes, structure, people, and IT aligned with its business strategy.

Addressing Misalignment Gaps

Manufacturing Maturity Model

Manufacturing-Maturity-Model


Culture of Continuous Improvement

Technology is an accelerator. Installing a best-in-breed MES system will not solve a process problem or a people problem. If a company attempts to solve a process problem by aligning technology to its current process, it will only accomplish performing a broken process more quickly. Our approach ensures that our customers receive more than just a state-of-the-art MES solution. Our project scoping, process mapping, KPI development, and training lay a foundation for our customers to drive a culture of continuous improvement across their factory and across their enterprise.


Scoping Process

Process mapping is included as a part of our scoping process, which is done in three parts. During the first phase, we teach the customer our methodology for MOM mapping (Manufacturing Operations Management), where we develop a process map to have a visual understanding of processes occurring on the plant floor, what data is measured during those processes, and how that data flows across the customer's network. This process helps the customer map their "current state."


Process Mapping

The graphic below illustrates a simplified process map where the bottom layer represents the physical process occurring in the plant’s receiving area. The second layer identifies hardware used to take a measurement or control a process. In this case, the truck drives over a scale to capture the gross weight. The third layer represents the data layer showing how the data is recorded and transmitted through the MES. In this example, our system pulls the receiving schedule from the ERP to check in the truck, receives the captured weight, and assigns a queue number for pre-unload inspection.

Process Map Example

Process-Mapping


Defining Value Drivers

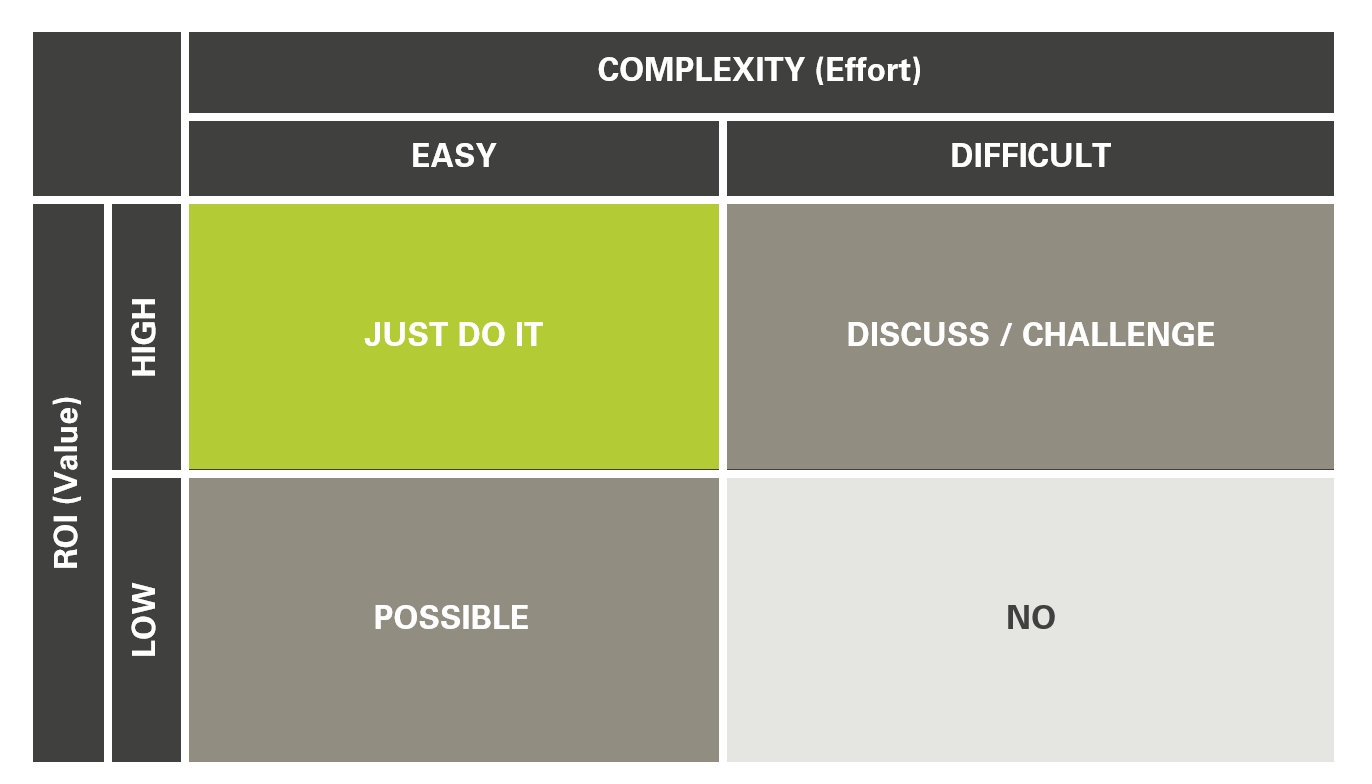
As part of the process mapping exercise, the team defines operational value drivers using a value-driver matrix. This helps our manufacturing customers prioritize project goals and develop measurable key performance indicators (KPIs) for data-driven decision-making. If a goal is determined to have a high ROI and is easy to implement, then it falls in the "Just Do It" quadrant. If a goal is difficult or costly to achieve and will return little value, then it falls into the "NO" quadrant.

Value-driver-matrix


Gap Analysis

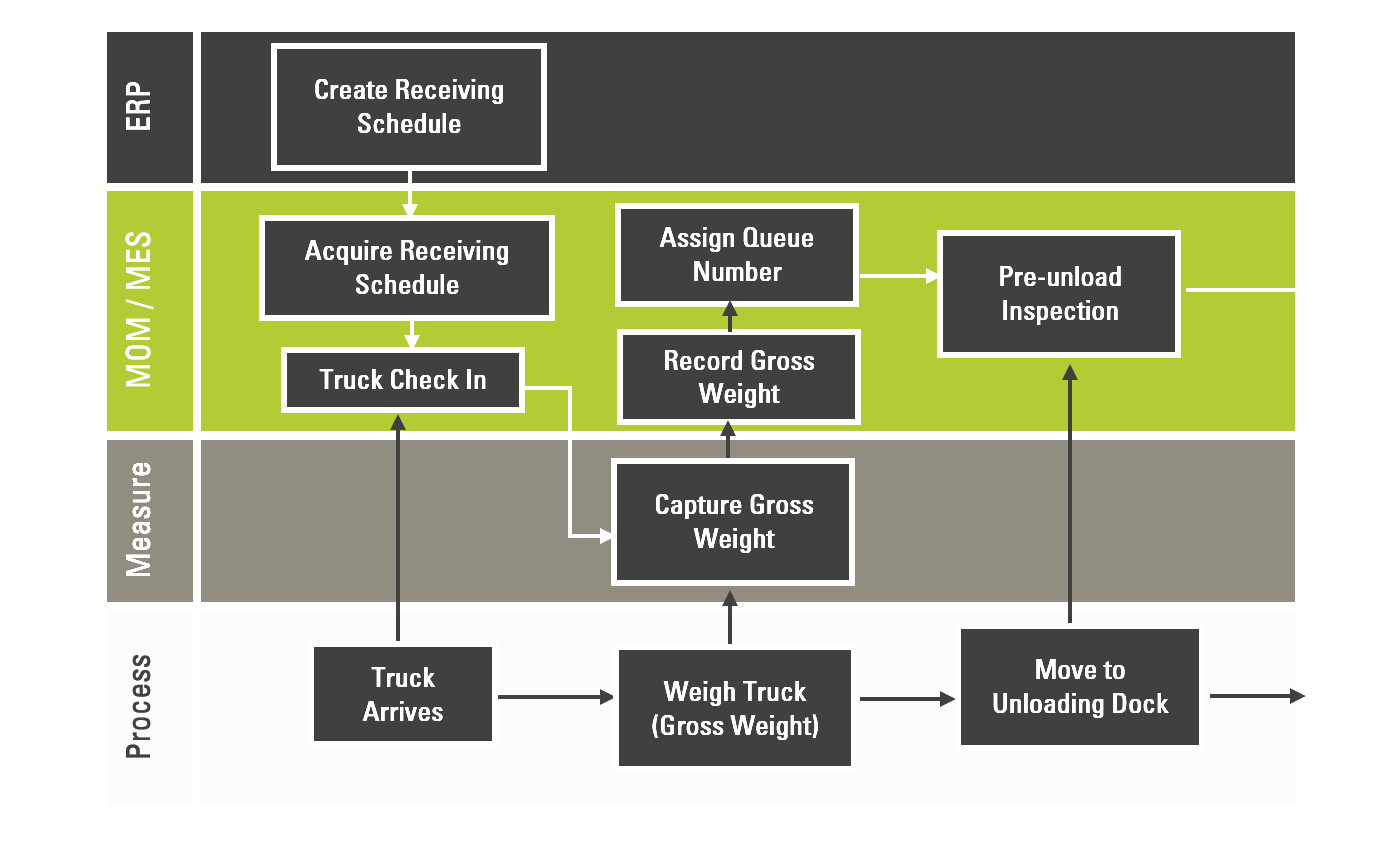
A key part of the process-mapping exercise is the gap analysis, where we define our "future state." The objective is to determine exactly how we will achieve the value drivers identified in the previous phase. This includes touring the facility, proposing software solutions, hardware, process engineering and improvements, procedural improvements, etc.

Gap-Analysis-1


Acceptance Criteria

The final deliverable from the requirements-gathering process is a master statement of work defining the objectives of the project with an extremely detailed scope of deliverables, milestones, and acceptance criteria. Acceptance criteria will be defined in the statement of work in its own dedicated section. The acceptance criteria should be listed by phase after the full detailed functional section. This will later be transposed in reference to acceptance criteria sign-off sheets. The signoff serves are an agreement that all deliverables for the phase have been met.


Multi-Site Rollout

In a multi-site implementation, the first site is used as a template site. During the process mapping exercise described above, a great deal of time is spent analyzing operations procedures in order to normalize data and business processes. This first site sets the standard for future sites. In previous multi-site projects, we’ve discovered variances across plants in how they define metrics and report KPIs. Some plants measured yield differently from others, or performance metrics like “equipment availability” or “Operational Equipment Effectiveness (OEE)” were defined differently. Some plant operators use certain exceptions, like “we don’t consider downtime when it is XYZ-related.” Our team works to uncover these variances to achieve standardized processes with normalized data across the enterprise to make data meaningful.

Once the template site is completed, future rollouts occur more efficiently and less costly. Our software is licensed per site, not per seat. Also, we offer multi-site customers a reduced licensed fee for additional sites. Service costs tend to be less on future rollouts because the customer is able to lead part of the process based on standards designed in the templating process.